Emerge
Our World In Data
Our World in Data


746 Million still live in extreme poverty.The world population was 7.18 billion in 2013.
- Prosperity
- Health
- Education
- Political Freedom
- Violence
Global Prosperity

Today's rich countries became rich very recently.
Income growth
How incomes grow
How long do you have to work to afford 1 hour of reading light?
(1,000 lumen hours; ±80 watt light bulb for 1 hour )
1800: Tallow candle 5.4 hours
1880: Kerosene lamp 13 minutes
1960: Filament bulb 3.6 seconds
1992: Compact fluorescent bulb 0.4 seconds
today: LED less than 0.1 seconds
“The price of anything is the amount of life you exchange for it”
– Henry David Thoreau

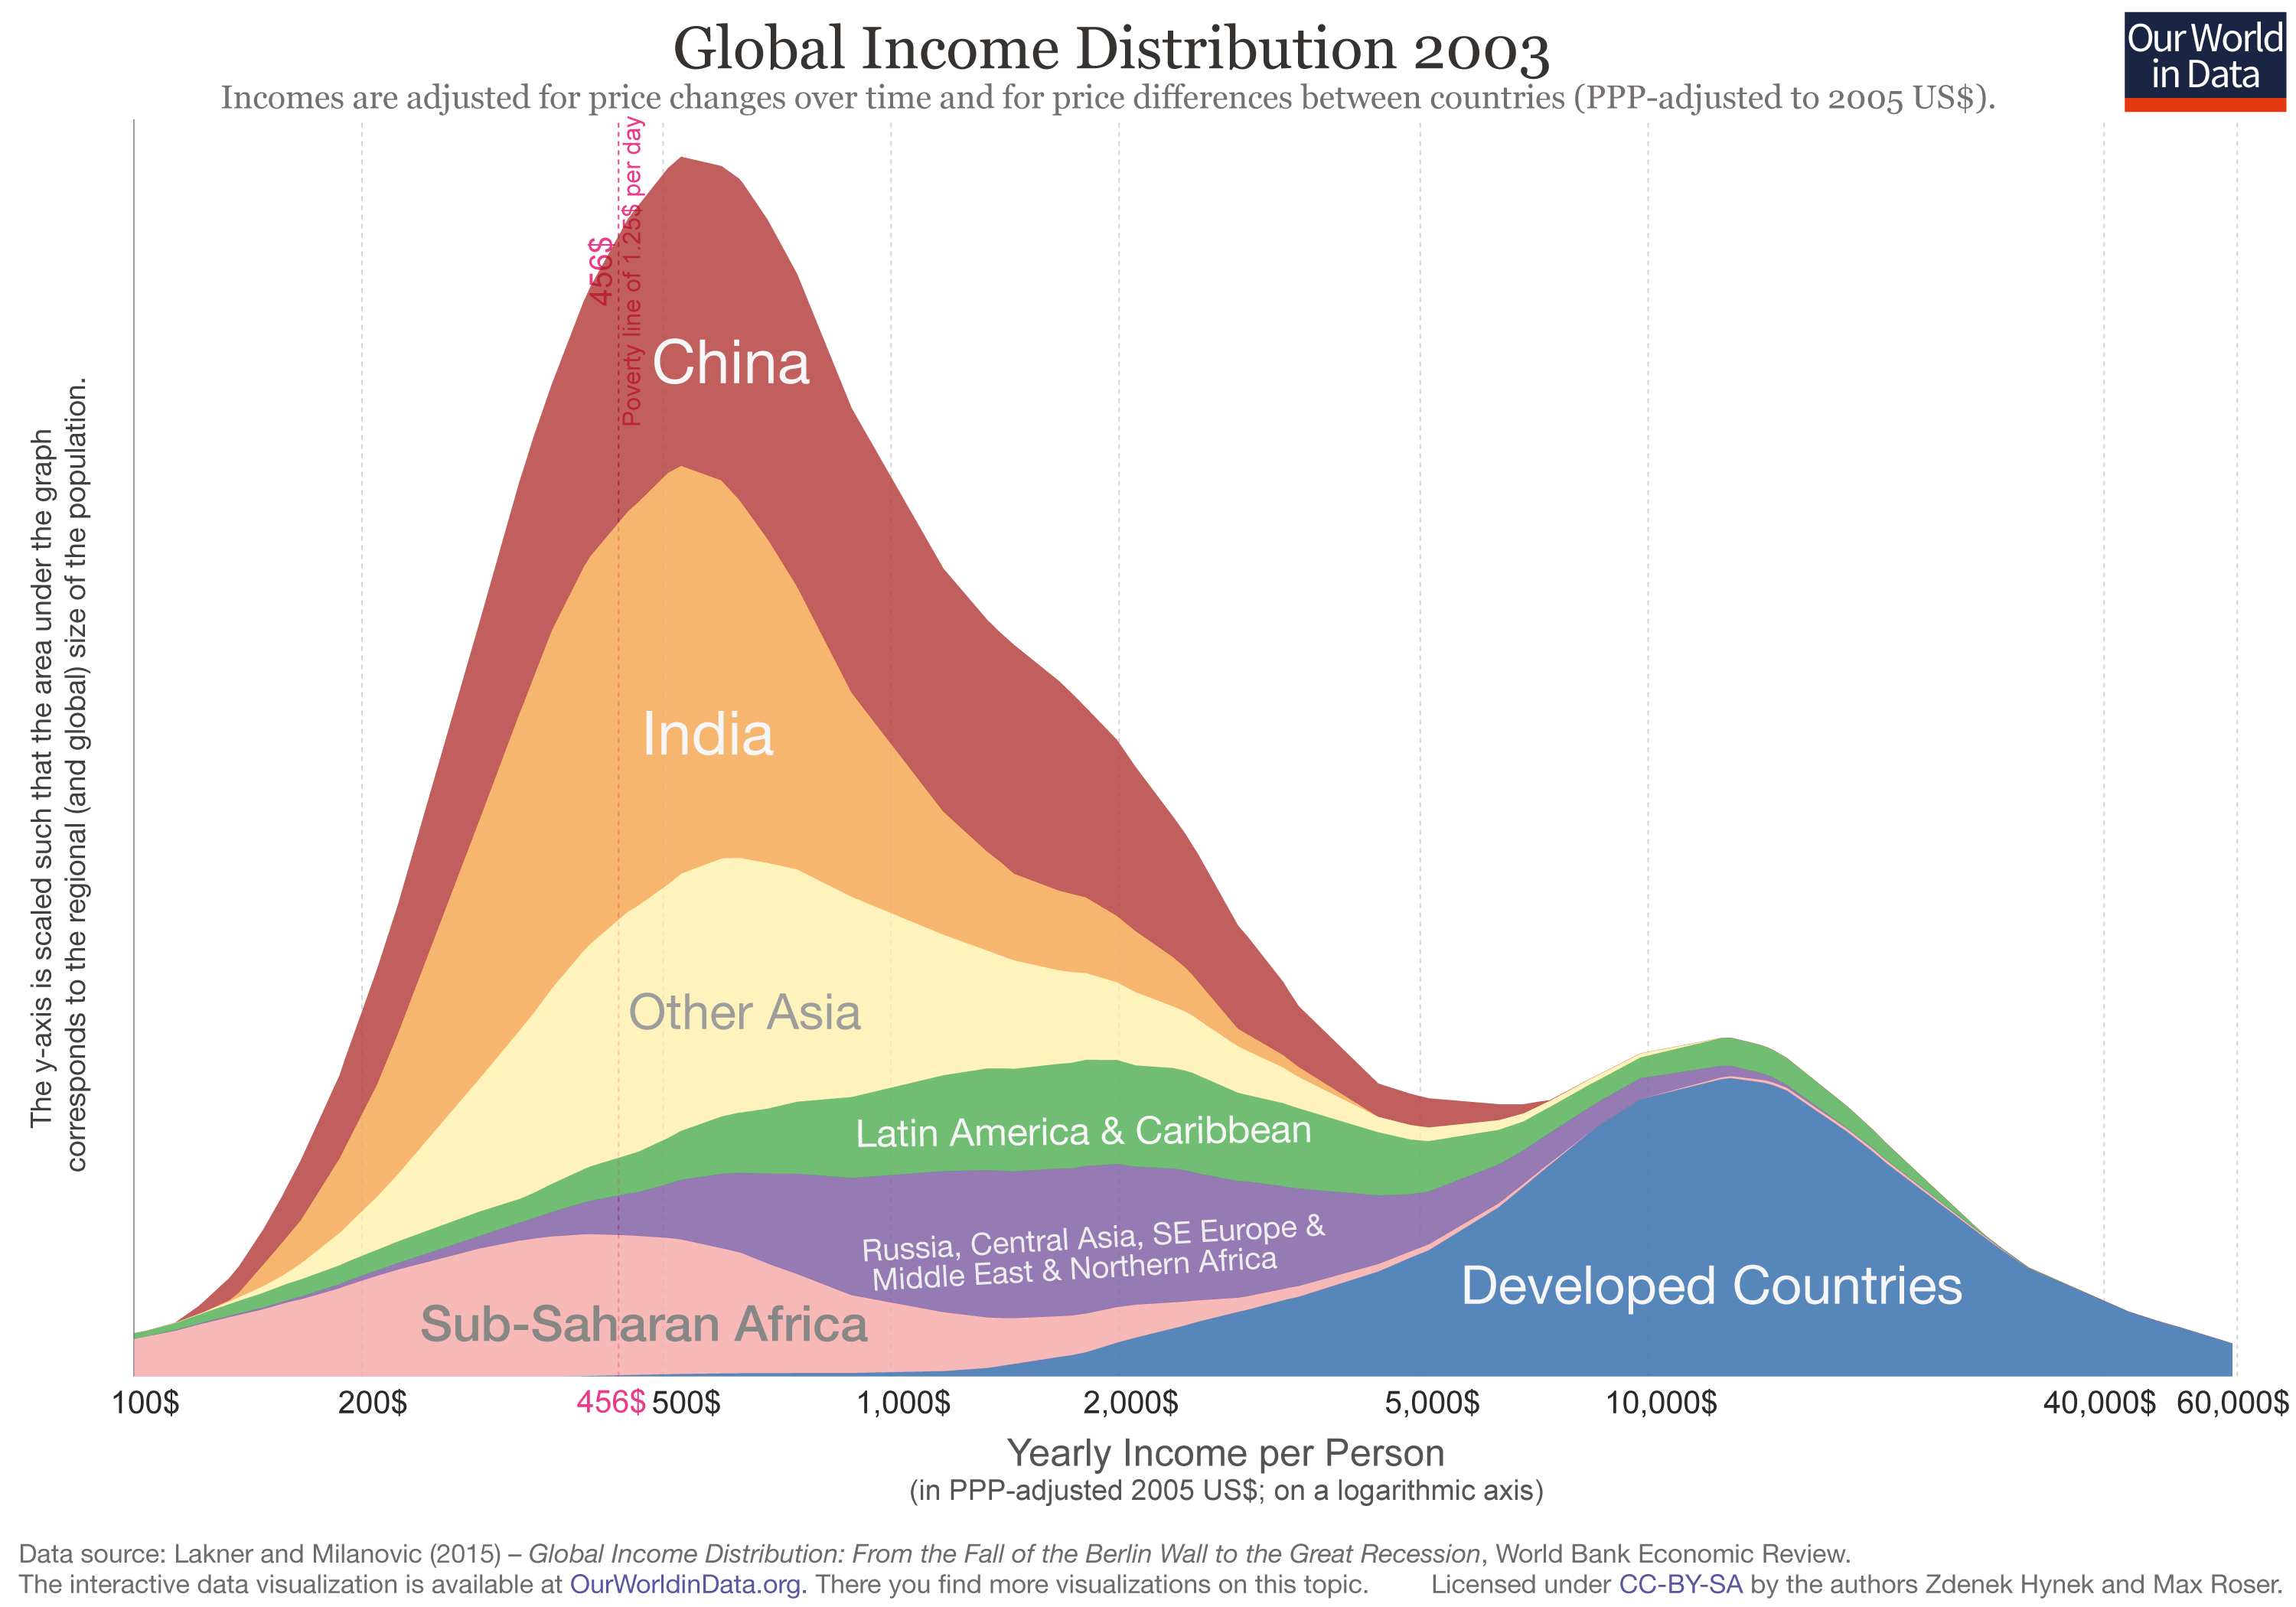
Global inequality. This is the distribution in 1988. A clearly devided world.

Changing global inequality.

Changing global inequality.

Changing global inequality.

Changing global inequality.

Changing global inequality.

Declining extreme poverty
.png)
But people do not know that extreme poverty is declining.
Declining extreme poverty
Better Health

"In 1800, 43% of the world's population died as children. By 1950 it was down to 20%. By 2013 it was down to 3.4%. This is a big win!"

"In 1800, 43% of the world's population died as children. By 1950 it was down to 20%. By 2013 it was down to 3.4%. This is a big win!"

"In 1800, 43% of the world's population died as children. By 1950 it was down to 20%. By 2013 it was down to 3.4%. This is a big win!"
Life expectancy in all world regions doubled.

But you would be wrong if you think it was child mortality only – life expectancy at all age levels increased.

Maternal mortality declined hugely.

A key innovation in health were vaccines. With vaccines it was possible to eradicate one of the worst diseases in history: Smallpox.

We should not forget how important vaccines were, also for you here in the US.

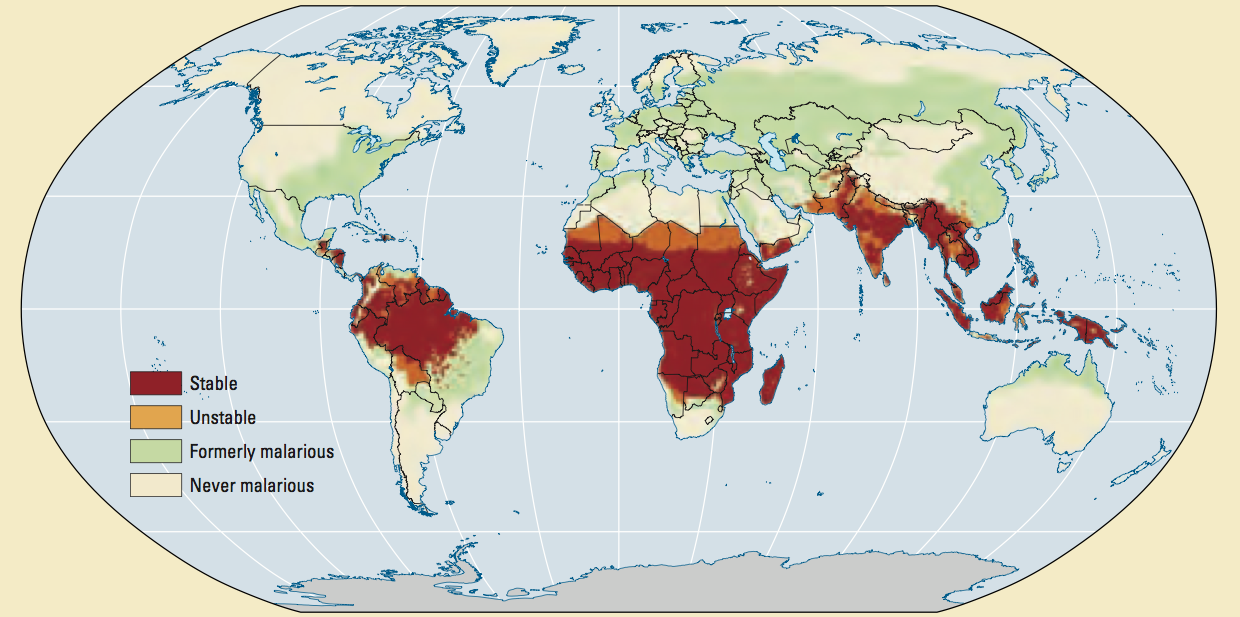
In many parts of the world malaria has been eradicated (in the US in 1951).

In many parts of the world malaria has been eradicated (in the US in 1951) and around the world, malaria mortality figures are falling.
Two diseases in which we make rapid progress and are getting close to eradicating the disease are polio and guinea worm disease. Here we see the latest data on guinea worm disease.
Global Education

The global average literacy rate in 1870 was 21%.
Years of schooling in 1870.In 1870 the literacy rate of the world was 21%.
Gender ratios for mean years of schooling, 1870 to 2010.
Fewer illiterate people
Education matters

The link between education and health

The link between education and health

The link between education and health

The link between education and health
Political Freedom
Political Freedom.
Political Freedom
Countries with higher educational attainment in the past are more likely to have democratic political regimes today

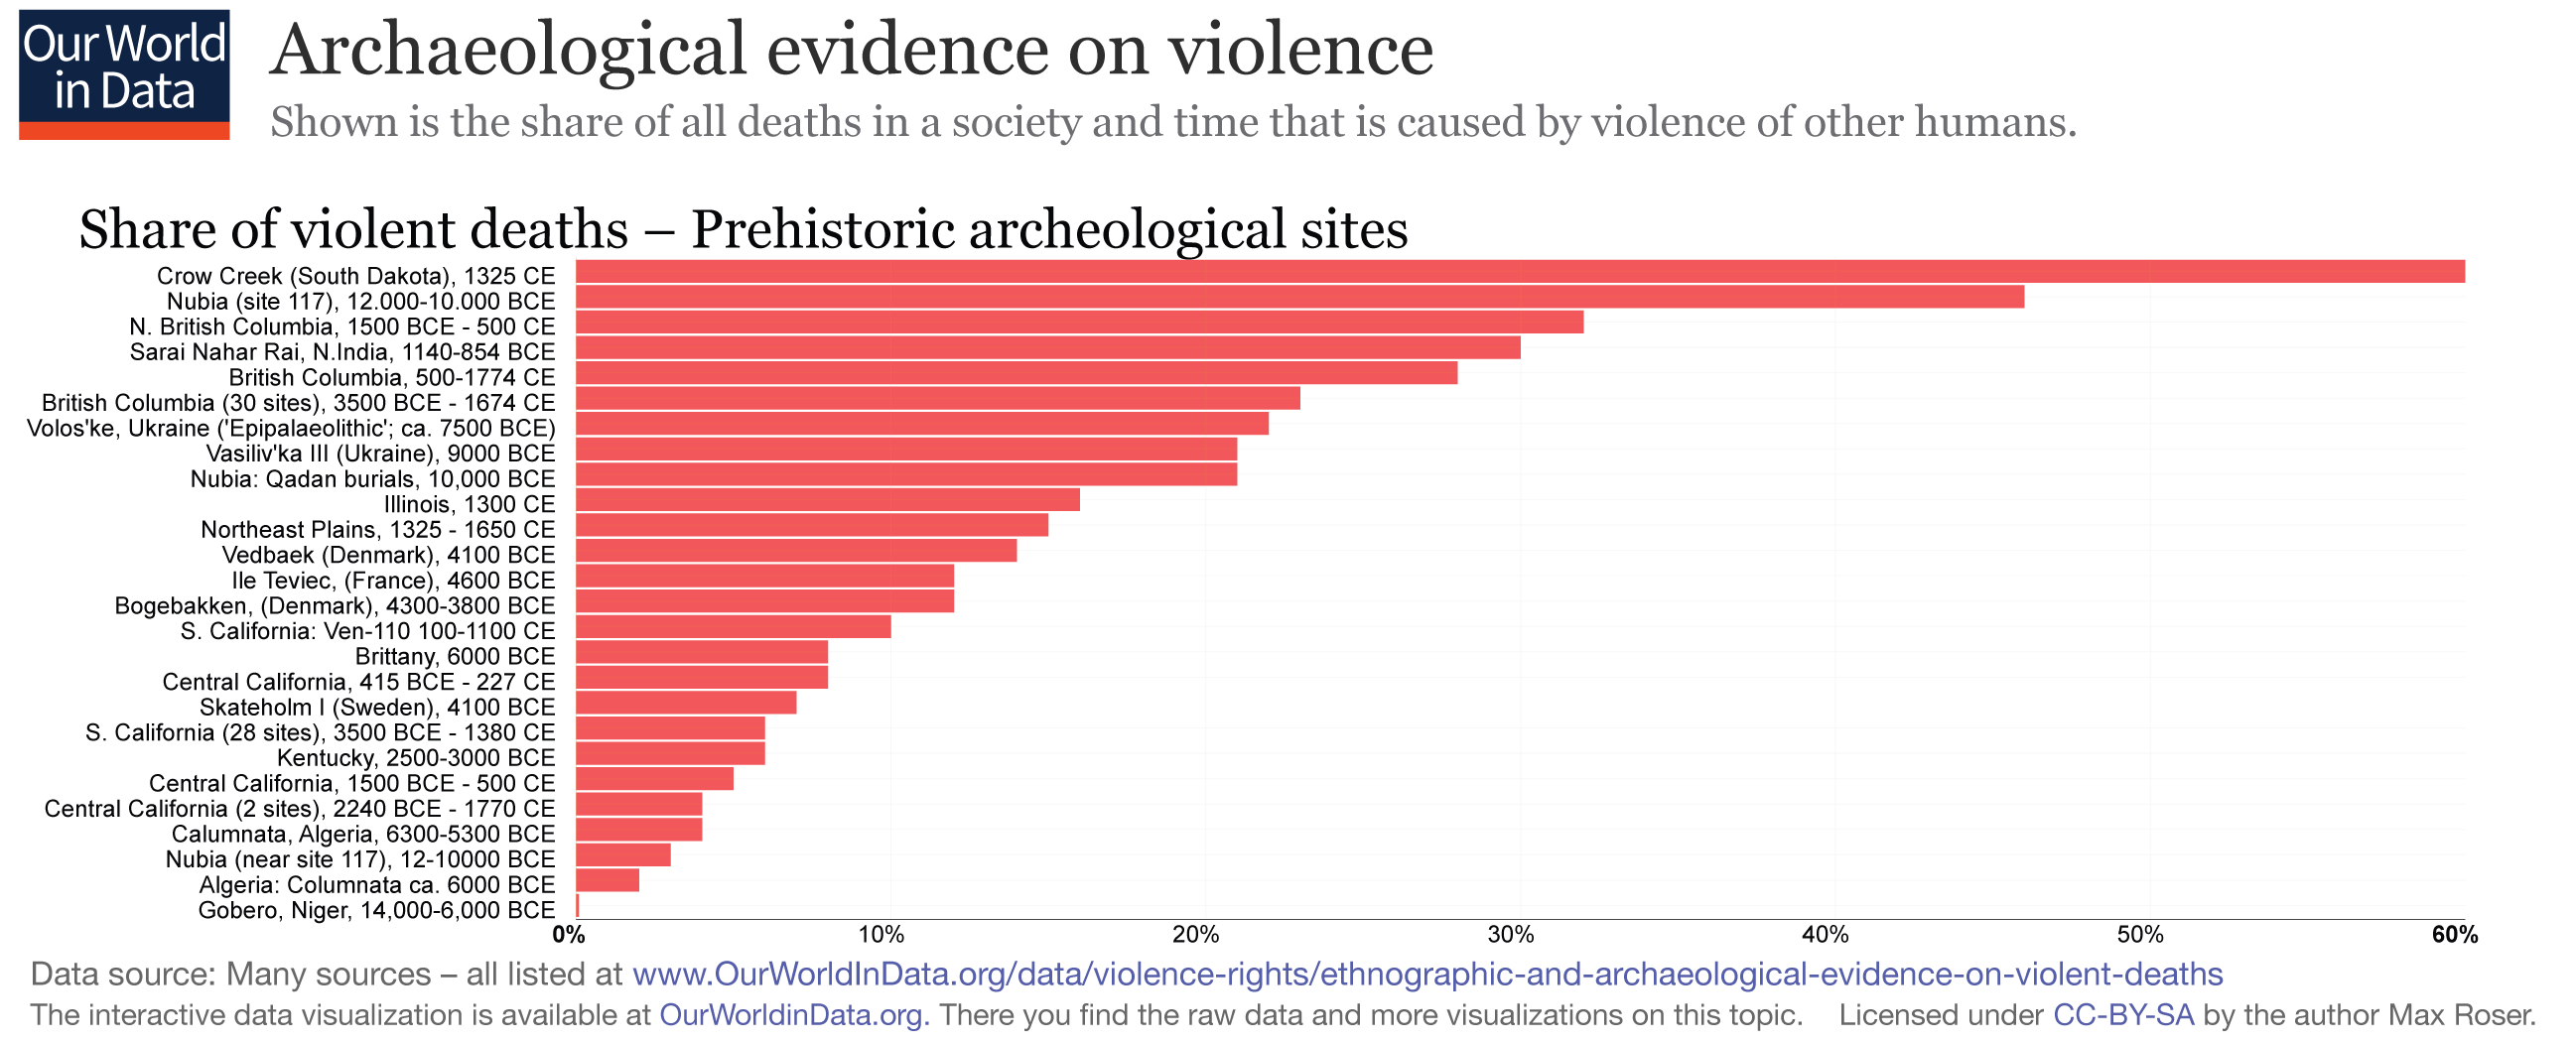
Archaeological studies show that societies in the past were very violent. Often more than 10% of deaths were the result of one person killing another.
In this chart I have included all the available archaeological evidence that I could find. You can find the (long) list of data sources by clicking on the chart.

Ethnographic evidence confirms that violence is very common in nonstate societies and drastically higher than in modern state societies.
This chart shows the ethnographic evidence. You can find the (long) list of data sources by clicking on the chart.

The historical record of homicide rates in Europe shows that modern levels of violence were only arrived at after a long decline.

Here we compare rates of violence - number of people killed per year, rather than share of deaths that were violent.
Once again, ethnographic studies show that violence in nonstate societies was much higher than in modern state societies.

This is a long-term view of wars and genocides.
The past was not peaceful.

As the Theory of Democratic Peace predicts, there has been a corresponding decline of war deaths.
Inclusive Growth

Inclusive growth?

Inclusive growth?

Inclusive growth?

Inclusive growth?

Inclusive growth?
The Future of Global Education

We can see how the world will change when we compare the education of the old generation with the generation of the young generation.

The younger generation is much better educated.
Projection of the Total World Population by Level of Education, 2015 – 2100 According to IIASA the world population will peak in 2070. The number of children will decline; only population momentum + longer lives increase the world population.
By 2100, almost no one without formal education; 3 billion with post secondary; more than 7 billion minds who will have received at least secondary education.3.2 billion are online. 44% of the world population.
Conclusion

From this perspective it is surprising that few are optimistic

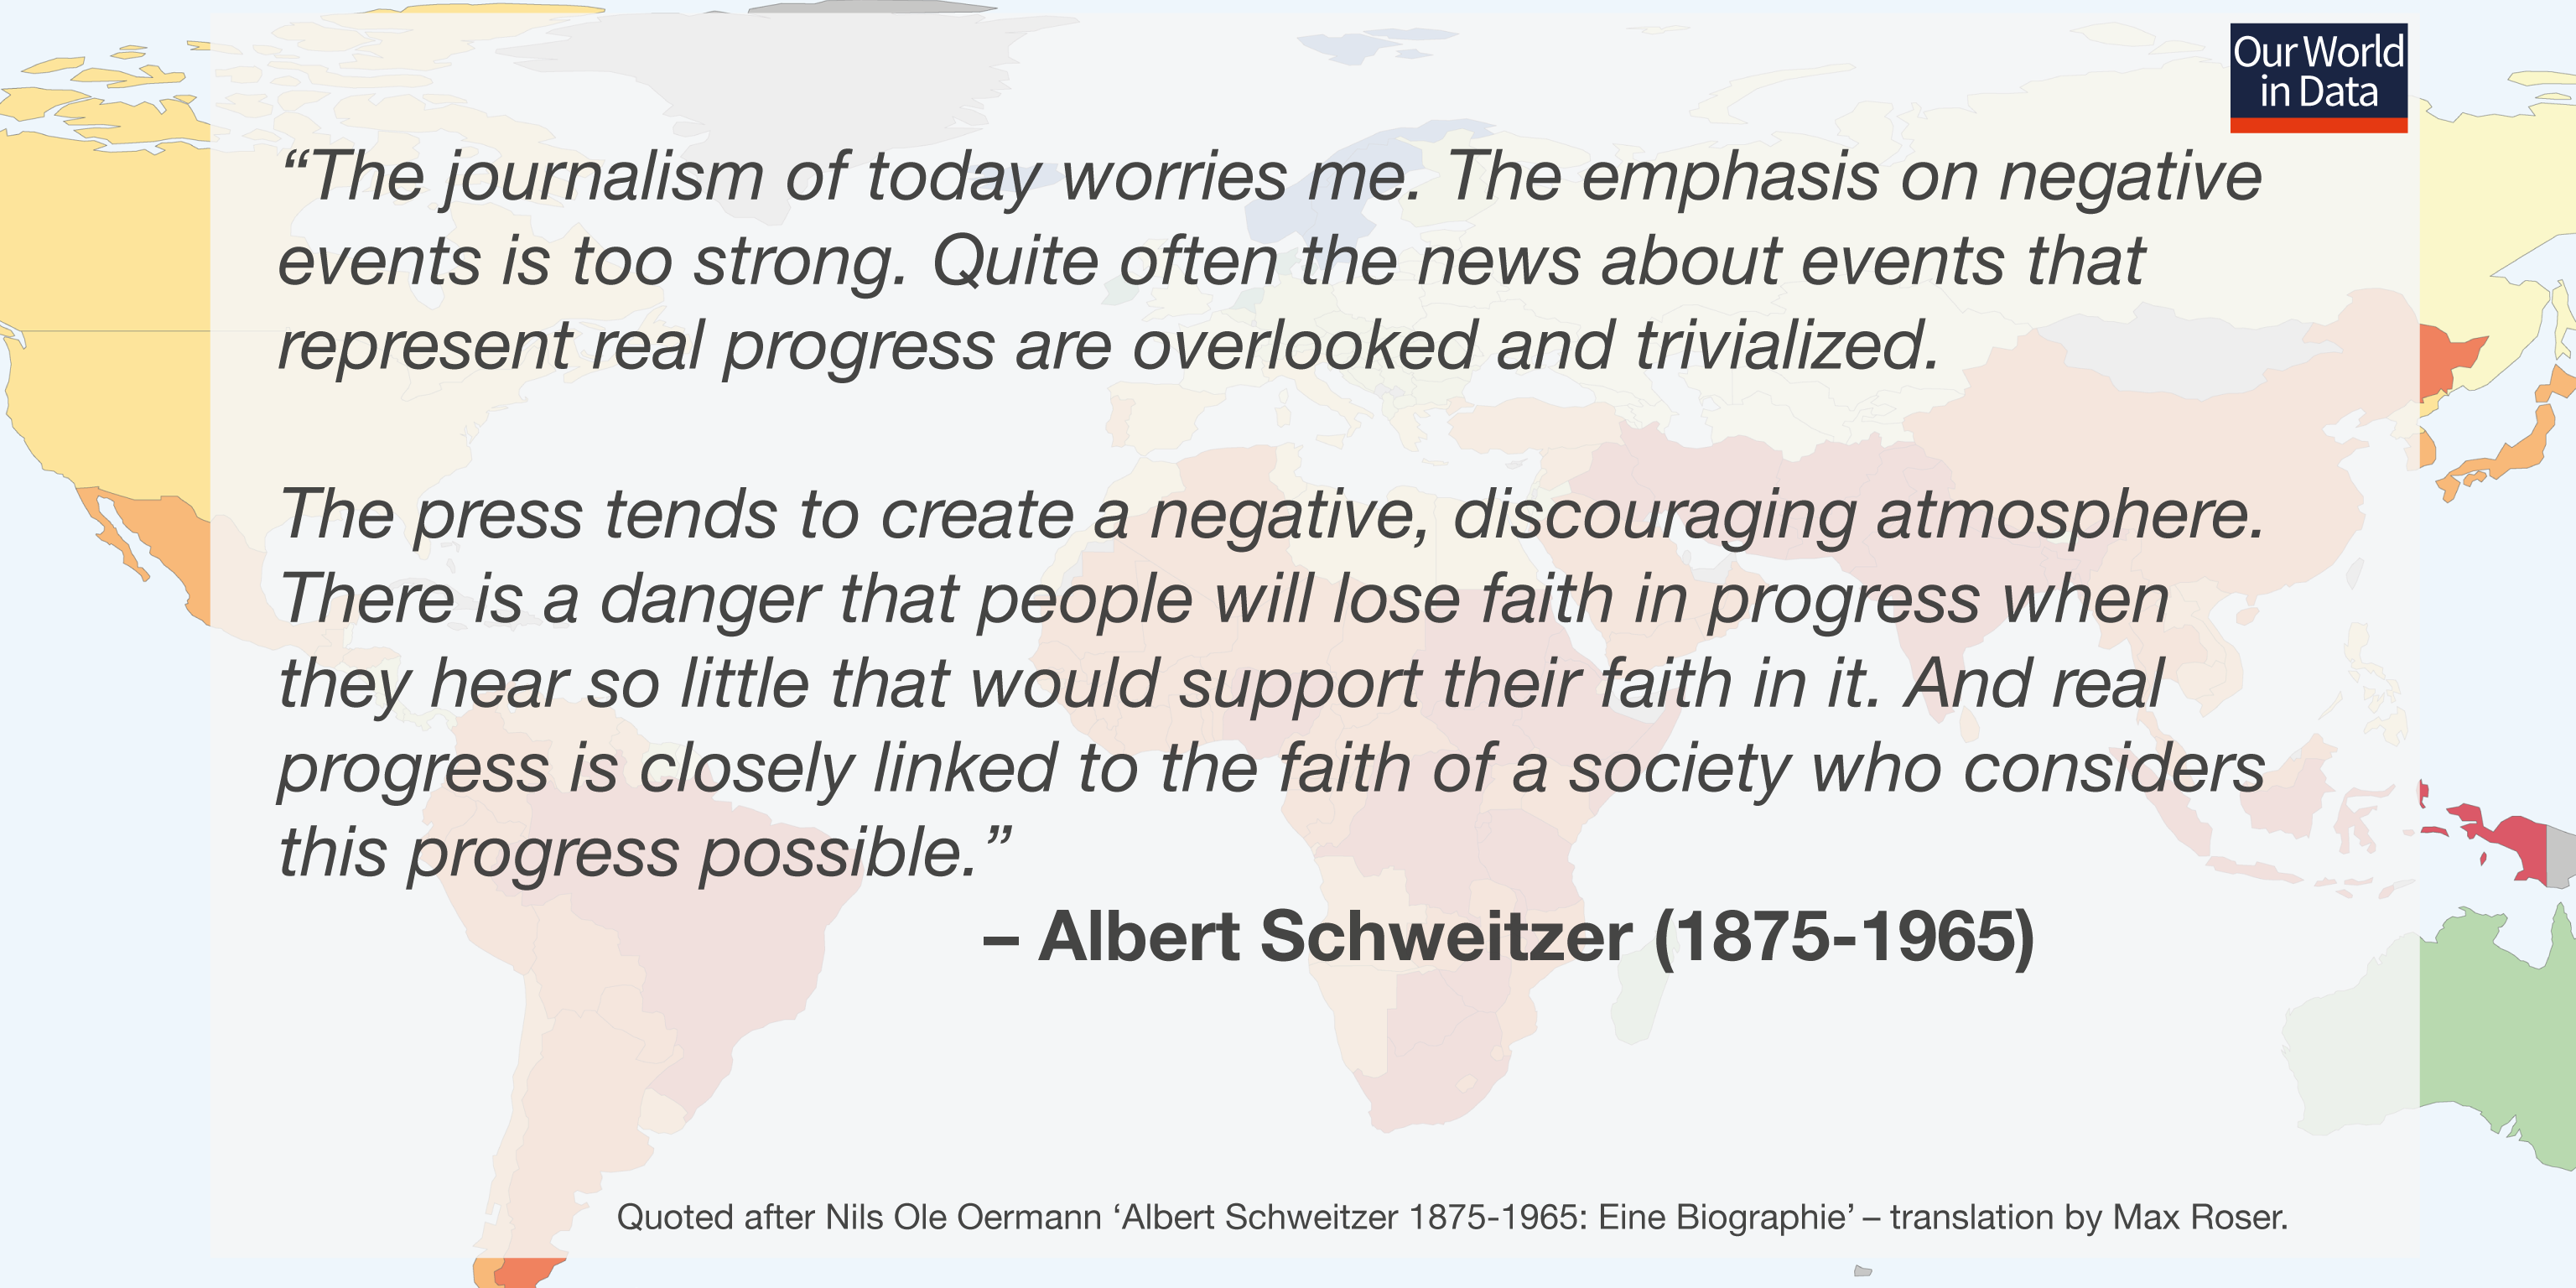
It is not only journalism – but also journalism – that is to blame.
Healthier
Richer
Better educated
More connected
Good conditions to take on big problems collaboratively.
Our World in Data